
Guided Tour
Please see below for a Quick Guide through the Actuaries Climate Index. We also have an in-depth Guided Tour, available as a PowerPoint or in HTML.
Quick Guide
• The Actuaries Climate Index® (ACI) is an index of climate risks not unlike the Consumer Price Index that monitors average price changes over time to a basket of standard goods and services.
• Actuaries measure and manage many types of risks: the Actuaries Climate Index measures climate risks on the basis of a basket of extreme climate events and changes in sea level.
• Increasing values in the index point to increased occurrences of extreme climate events.
• To explore the index, select Regional Graphs, Component Graphs, or Maps under the EXPLORE menu to go directly to the screen showing aggregate index values for the US and Canada and look at continental USA or Canada, or if you prefer, at one of the 12 regions of particular interest to you.
• The default display will show you seasonal values but you can also select monthly values, both color coded to emphasize values that are comparatively unusual for that period. The key metric is the five-year moving average shown by the black line. Illustrative example:
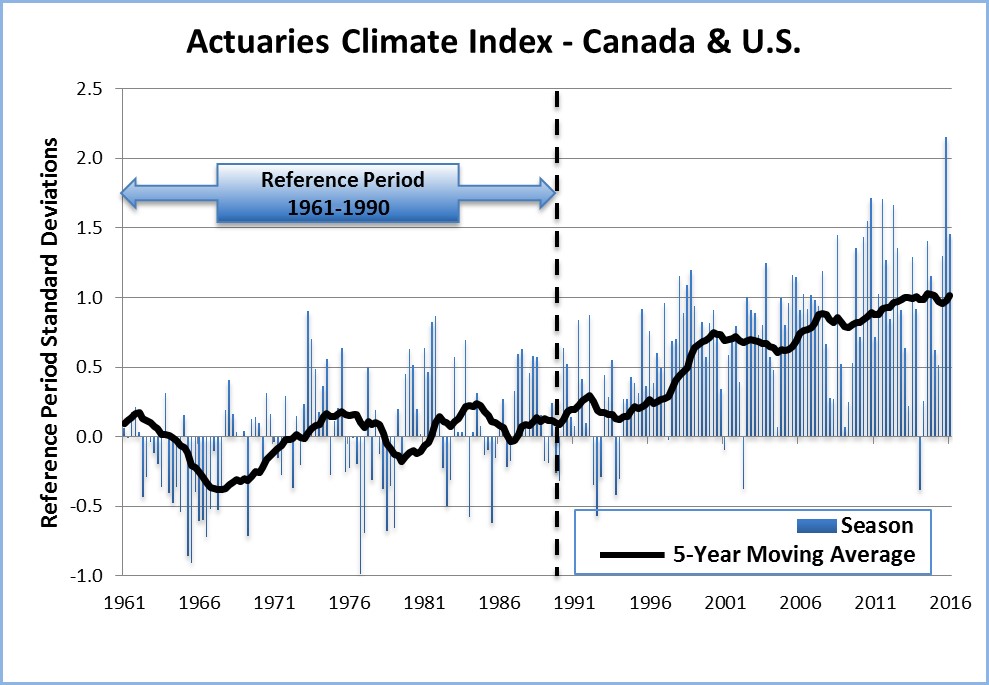
• Starting with a reference period from 1961 to 1990, from which the index was set at zero, the ACI has risen steadily. (Please note that the ACI for the US and Canada is not the weighted average of the two countries.) The latest news release summarizing index values is available here.