
Data Disclosure
Data Disclosure for the Actuaries Climate Index®
February 27, 2025
In performing the work to produce the current values through fall 2023 for the Actuaries Climate Index (ACI) and its six components, the American Academy of Actuaries (Academy), Casualty Actuarial Society (CAS), Canadian Institute of Actuaries (CIA), and Society of Actuaries (SOA) relied upon methodology developed in collaboration with Solterra Solutions and data and information from a number of publicly available data sources: the National Oceanic and Atmospheric Administration (NOAA), GHCNDEX1 (CLIMDEX)2, and Permanent Service for Mean Sea Level. We reviewed the data and information provided for reasonableness but did not perform detailed audits. We have, therefore, relied upon each of these sources to provide accurate and complete data and information.
The underlying data for the ACI and its six components is based on measurements from an extensive network of meteorological stations and coastal tide stations within the United States (excluding Hawaii and unincorporated United States territories) and Canada. Some of the ACI data source providers have analyzed meteorological station observations to produce gridded data sets. For all ACI components except sea level, 2.5 degree latitude by 2.5 degree longitude grid data is used to develop ACI values.
The grid data and sea level station data are used to develop monthly and seasonal regional time series beginning in 1961 for the ACI and its components.
In reviewing the underlying data, we noted that not all grids and sea level stations had observational data for every month or season in the time series under study—potentially impacting the accuracy of the analysis and results for the ACI and its components. Missing data is more common in the most recent months or seasons because the data used for the ACI and its components may not be updated to reflect the most recent station observations.
For sea level, because those stations included in the analysis are sparser than the meteorological stations used to produce the grid data for the other components, values for missing data are estimated by interpolation and extrapolation.
To compute CDD, Rx5day, T90 and T10, the ACI uses monthly GHCNDEX gridded data from 1961 to the present. In some instances, the GHCNDEX dataset has missing values. For example, the value for Rx5day is missing in August of 2018, for the grid centered at 47.5N and 80W.
While the GHCNDEX data has a high rate of completeness for years prior to 2000, the frequency of missing values has increased in recent years, particularly in northern Canada. Our understanding is that this deterioration of the gridded data is due to a reduction in the number of weather stations operating in northern Canada.
Changes in the geographical coverage of the GHCNDEX data can potentially introduce noise into the ACI’s results. For example, with respect to Canada as a whole, we determined that the grid points that have recently dropped out of the data set have, historically, experienced less rainfall than those grid points for which data is still available. The Canada grid points that continue to provide data are associated with relatively rainy locations. As a consequence, a slight upward bias was injected into our Canada Rx5day results for recent years. This bias is unrelated to changing weather patterns; rather, it is the result of the unstable geographic coverage of the gridded data.
To address this issue, we have altered our methodology by introducing a new calculation step: prior to running the ACI calculation process, we first filter out grid points that are unstable across time, leaving us with a stable set of grid points for which each month’s data has been available at least 90 percent of the time in each decade from 1960 to the present.
We introduced this change of methodology in the April 2019 release. The methodology is retrospective in the sense that it triggers a restatement of past results all the way back to 1961.
The change of methodology has almost no impact whatsoever on results for the USA, or for any of its component regions, because the associated gridded data has virtually no missing values.
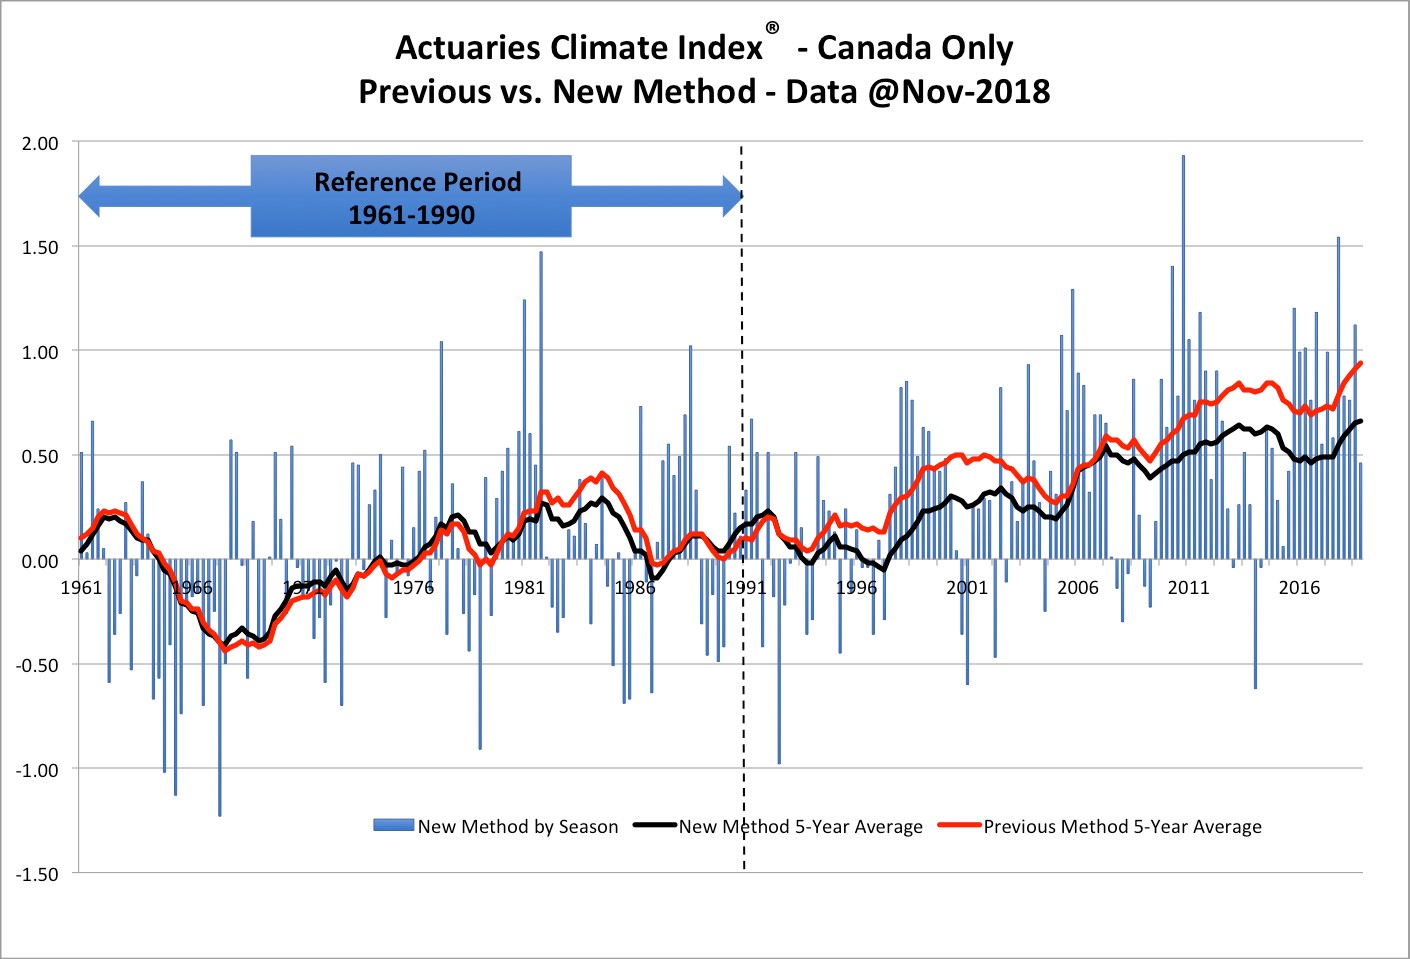
For Canada, the change in methodology has visible effects, which vary by Canadian region and ACI component. In general, however, the time series produced using the new methodology are highly correlated with the corresponding time series produced using the prior methodology. For Canada as a whole, the new methodology slightly reduced the combined ACI anomalies across the last 30 years (see graph below). Despite this shift, the general story remains unchanged: both the new methodology and the prior methodology produce a gradual upward trend across the last 20 years.
As a result of filtering out unstable grid points, there is no longer any data available for CDD for region CAR. Therefore, the graph of CAR-CDD has been removed from the website. In addition, CDD is no longer included in the calculation of the combined ACI values for region CAR. Instead, for region CAR, the combined ACI reflects only those four metrics for which data is available: Rx5day, T10, T90, and wind.
Also, the data filtering process results in no available Rx5day data for the months of April and November in region CAR. To address this issue, we use linear interpolation based on adjacent months to fill in the missing values for April and November before standardization. Exhibit 1 shows the number of valid grids by region, component, and month.
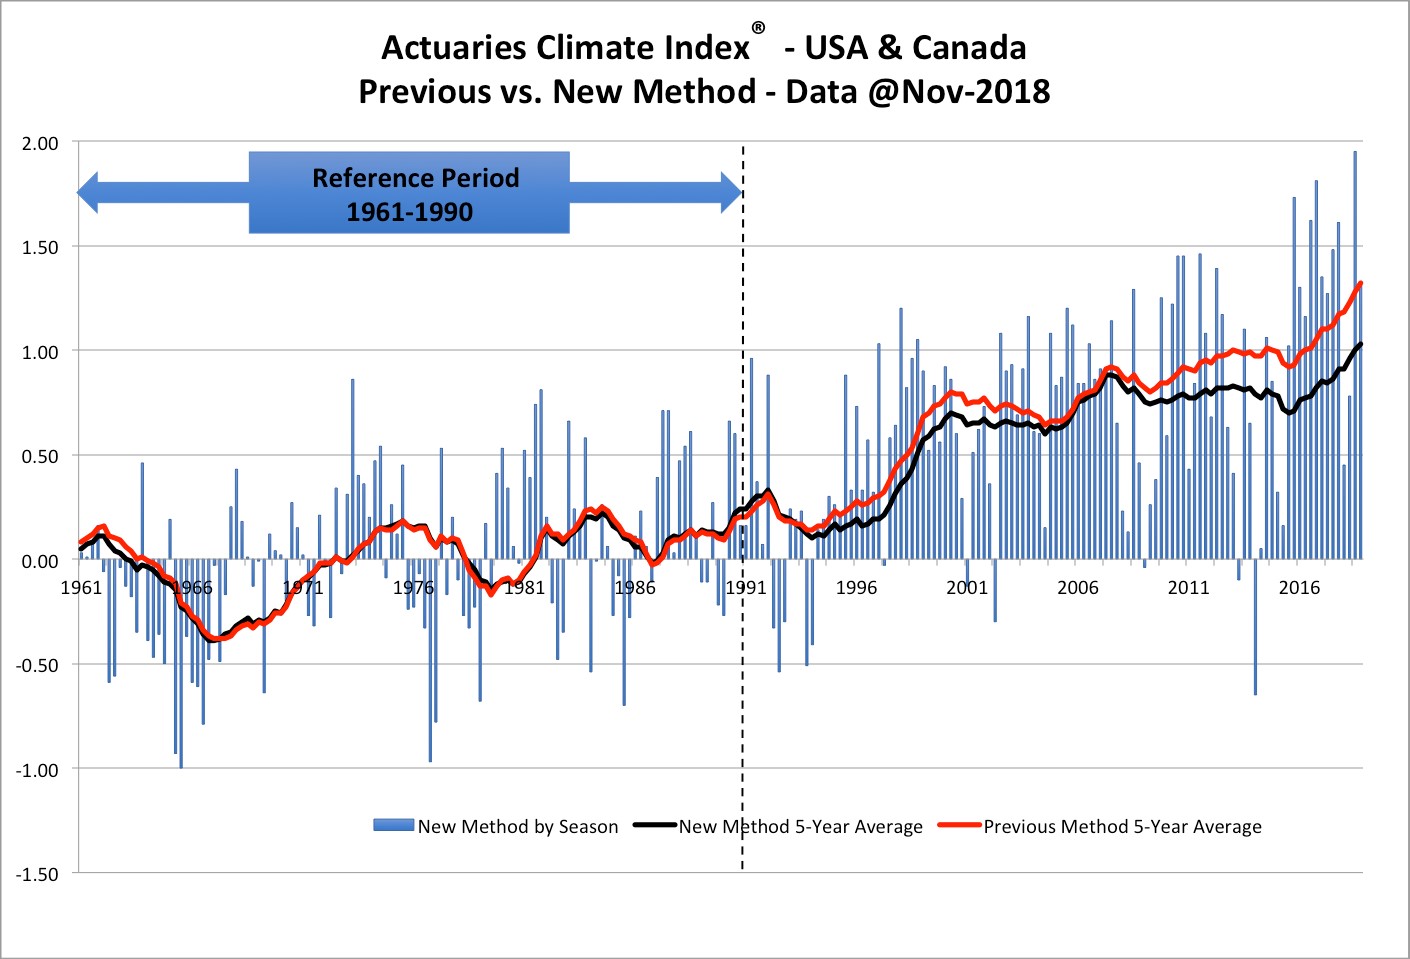
The following graph shows the change in the index for the United States and Canada combined.
Our analysis of the missing values shows the following:
- For contiguous US regions, there are few data holes, and data quality is consistent over time. Alaska (ALA) is unique in comparison to the other US regions, as the number of grid observations changes by season.
- Missing values vary by latitude. Missing values become more prevalent the further north one goes. For example, in region CAR, which uses the 60th parallel as its southern border, there are no valid grids centered above 62.5 degrees north for Rx5day, using the new 90 percent standard.
- The missing values also affect the weights used to combine the United States and Canada into the overall total index for both countries. Previously, the declining number of valid grids in Canada was causing it to have a gradually decreasing weight. The new method keeps the country weights relatively constant, although there is still some variation by month and region as can be seen in Exhibit 1.
Historical results for the ACI and its components may change with each website update because the underlying data may change. Data values may be updated by third parties, not only for recent months and years, but also for prior time periods.
In addition, historical results for the ACI and its components may change with each website update due to changes in the underlying methodology for determining these results.
Note that the scale of the ACI is in standard deviations for each component. Therefore, a component index value of 1.0 indicates that the index is one standard deviation above the mean value of that index during the reference period, based on the reference period standard deviation.
As an example, consider the temperature component T90, which describes the upper tail of the distribution of daily temperatures. Assuming temperatures (and also the exceedances represented by T10 and T90) are normally distributed, about one-third of the time one expects that T90std will be outside the interval ±1, and one-sixth of the time it will be greater than +1. But if it exceeds +2, this is indicative of a rare event, because it is expected only 2.5 percent of the time. In the absence of changes in weather patterns relative to the reference period, values exceeding +3 are very rare, and expected only approximately 0.125 percent of the time during the reference period. These frequencies can change across time due to shifts in weather patterns. In the case of T90 std upward shifts in the temperature distribution have led to an increase in the frequency of large positive anomalies.
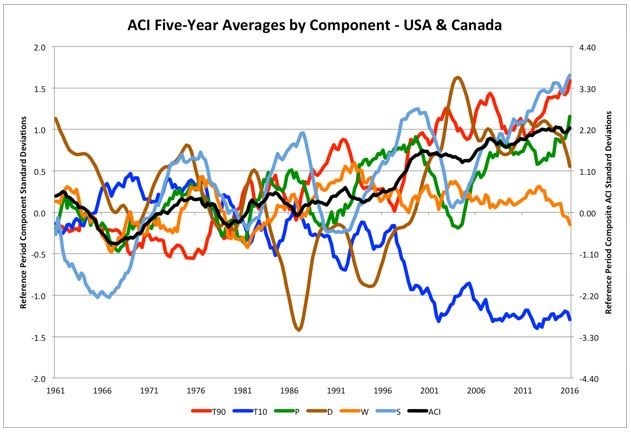
The composite index and its five-year rolling average are also shown on the same scale in the website graphs and documentation, for ease of comparison with the component indices, but the standard deviation for the composite is approximately 0.45 (depending on region). The lower standard deviation of the composite index results from its construction as the mean of the six components, which has the effect of lowering the variability of the composite relative to the variability of the components. The graph below illustrates this effect by showing two y-axis scales: standard deviations for the composite ACI should be read from the scale on the right and component standard deviations should be read from the left to properly assess the rarity or likelihood of index values being at a given level. Stated differently, because the composite index is calculated as the mean of the components, its values should be read from the left scale—but its standard deviations, for purposes of determining likelihood, should be read from the right scale.
The Academy, CAS, CIA, and SOA continue to explore ways to enhance the ACI and its components, which could impact historical results. Therefore, historical ACI results may change with each website update due to the implementation of a new data source or application of a new methodology/technique for the analysis of the ACI and its components.
For more information on the data and development of the ACI, see the Development and Design document and Terms of Use. Prior data disclosures are available upon request.
1GHCNDEX National Center for Atmospheric Research Staff (Eds). “The Climate Data Guide: GHCNDEX: Gridded Temperature and Precipitation Climate Extremes Indices (CLIMDEX Data).” Retrieved from https://climatedataguide.ucar.edu/climate-data/ghcndex-gridded-temperature-and-precipitation-climate-extremes-indices-climdex-data.
2CLIMDEX (Datasets for Indices of Extreme Weather) is developed and maintained by researchers at the Climate Change Research Centre (CCRC), The University of New South Wales (UNSW), and funded by the Australian Research Council and the Australian Department of Climate Change and Energy Efficiency through Linkage project LP100200690 and in collaboration with the University of Melbourne, Climate Research Division (Environment Canada), and NOAA’s National Climatic Data Center (US). See also: Expert Team on Climate Change Detection and Indices at the World Meteorological Organization.
